Executive Visit Dashboard
Executive Visit Dashboard
Single-scroll Green Office FY2569 briefing — resource performance, criteria progress, evidence, and activities (not an official assessment score).

Data table
Monthly data coverage: 44 of 72 slots (61%) · data coverage, not an assessment score
| Resource | Months covered |
|---|---|
| Energy | 8 |
| Water | 8 |
| Fuel | 7 |
| Paper | 7 |
| Waste | 7 |
| GHG | 7 |
| Total | 44/72 |
GREEN COMMAND CENTER
Monthly Data Coverage 2569
61 %
44/72 months · 61%
Data coverage — not an assessment score. 2569 figures are partial-year and adjust as data entry continues.
FY2569 DATA STATUS
Resource Pulse
FY2569 data entry status across six resources
6 In Progress 0 Data Pending
Energy
301.8K kWh
8 months of 12
Source: 1.2electric.xlsx (energy-2569.csv) — partial, 8 of 12 months
View dashboard
Water
6.2K m³
8 months of 12
Source: 1.1Water.xlsx (water-2569.csv) — partial, 8 of 12 months
View dashboard
Fuel
396.4 L
7 months of 12
Source: 1.3Gassolene.xlsx (fuel-2569.csv) — partial, 7 of 12 months
View dashboard
Paper
1.2K kg
7 months of 12
Source: 1.4paper.xlsx (paper-2569.csv) — partial, 7 of 12 months
View dashboard
Waste
3.9K kg
7 months of 12
Source: 1.5waste2026.xlsx (waste-2569.csv) — partial, 7 of 12 months
View dashboard
GHG
144.8 tCO₂e
7 months of 12
Source: 1.6GreenHouseGas2026_New.xlsx (ghg-2569.csv) — partial, 7 of 12 months
View dashboardExecutive Highlights & Next Actions
Year-over-year uses same-period overlap months only · Monthly coverage is derived per resource from canonical data.
Improving (1)
- Paper (7/12 mo) -2.7%
Needs Attention (5)
- Energy (8/12 mo) +10.5%
- Water (8/12 mo) +17.8%
- Fuel (7/12 mo) +16.6%
- Waste (7/12 mo) +14%
- GHG (7/12 mo) +11.8%
Partial-Year Coverage (6)
- Energy 8/12
- Water 8/12
- Fuel 7/12
- Paper 7/12
- Waste 7/12
- GHG 7/12
Criteria Needs Attention (Progress)
- 3 Resource and Energy Utilization (10)
10 indicators with open work (10 in progress · 0 not started)
- 1 Environmental Policy and Green Office Planning (7)
7 indicators with open work (5 in progress · 2 not started)
- FY2569 data unavailable (43)
43 indicators still lack verified FY2569 data — awaiting sources
Progress counts — not an official assessment score
Monthly Performance Trends (All Resources)
FY2569 monthly trends by resource — gaps = months with no data yet (never treated as 0).
Monthly trend summary FY2569: Energy: 8/12 months, kWh; Water: 8/12 months, m³; Fuel: 7/12 months, L; Paper: 7/12 months, kg; Waste: 7/12 months, kg; GHG: 7/12 months, tCO₂e. Gaps = no data.
Water
8/12 monthsFuel
7/12 monthsPaper
7/12 monthsWaste
7/12 monthsGHG
7/12 monthsData table
Monthly data table FY2569 by resource
| Resource | Unit | Coverage | Jan | Feb | Mar | Apr | May | Jun | Jul | Aug | Sep | Oct | Nov | Dec |
|---|---|---|---|---|---|---|---|---|---|---|---|---|---|---|
| Energy | kWh | 8/12 months | 28618.4 | 30300 | 33001.8 | 43295.8 | 40012.8 | 45390.4 | 43975.2 | 37210.4 | — | — | — | — |
| Water | m³ | 8/12 months | 1098.4 | 944.6 | 909.7 | 858.3 | 539.96 | 574.71 | 646.36 | 592.91 | — | — | — | — |
| Fuel | L | 7/12 months | 82.44 | 23.46 | 39.18 | 39.07 | 48.89 | 106.79 | 56.54 | — | — | — | — | — |
| Paper | kg | 7/12 months | 145.13 | 175.31 | 157.17 | 145.61 | 225.85 | 166.59 | 224.1 | — | — | — | — | — |
| Waste | kg | 7/12 months | 452.4 | 587.8 | 703.5 | 512 | 536 | 565 | 553 | — | — | — | — | — |
| GHG | tCO₂e | 7/12 months | 16.129 | 17.091 | 18.458 | 23.268 | 21.732 | 24.444 | 23.681 | — | — | — | — | — |
For same-period YoY and baseline index comparisons — open the full executive dashboard
FY2569 Operational Progress
Current YearIndicator implementation progress — not an official assessment score and not environmental performance.
5 of 65 indicators ready (7.7%)
across 65 indicators
5
7.7%
Ready
15
23.1%
In Progress
2
3.1%
Not Started
43
66.2%
Unavailable
20
30.8%
Started (Ready + In Progress)
45
69.2%
Remaining (not started 2 · unavailable 43)
Needs Attention (data-derived)
- 3 Resource and Energy Utilization — 10 indicators with open work (10 in progress · 0 not started)
- 1 Environmental Policy and Green Office Planning — 7 indicators with open work (5 in progress · 2 not started)
- FY2569 data unavailable — 43 indicators still lack verified FY2569 data — awaiting sources
Derived from indicator counts only — no inference.
All 7 Categories — FY2569
Indicator counts per status in each category — scannable at a glance.
Data table
Progress data table, FY2569
| Category | Indicators | Ready | In Progress | Not Started | Unavailable | Ready % |
|---|---|---|---|---|---|---|
| 1 Environmental Policy and Green Office Planning | 18 | 2 | 5 | 2 | 9 | 11.1% |
| 2 Communication and Awareness Cultivation | 6 | 3 | 0 | 0 | 3 | 50% |
| 3 Resource and Energy Utilization | 15 | 0 | 10 | 0 | 5 | 0% |
| 4 Waste Management | 5 | 0 | 0 | 0 | 5 | 0% |
| 5 Environment and Safety | 13 | 0 | 0 | 0 | 13 | 0% |
| 6 Procurement and Hiring | 6 | 0 | 0 | 0 | 6 | 0% |
| 7 Green Office Operations for Continuity | 2 | 0 | 0 | 0 | 2 | 0% |
Ready In Progress Not Started Unavailable
FY2569 Evidence Readiness
EVIDENCE — separate from progressWork may be done while evidence is incomplete — progress (green) and evidence readiness (blue) are independent axes.
Verified 3 Available, Unverified 17 Unavailable 45
Verified = content-reviewed documents · Available-unverified = OCR-derived or pending human verification · Unavailable = no FY2569 document yet.
7 Green Office Categories — Summary
FY2569 implementation progress by category · No official assessment scores yet
Category 1 18 indicators
Environmental Policy and Green Office Planning
- Ready
- 2
- In progress
- 5
- Not started
- 2
- Unavailable
- 9
Ready rate: 11.1%
Awaiting official assessment
Category 2 6 indicators
Communication and Awareness Cultivation
- Ready
- 3
- In progress
- 0
- Not started
- 0
- Unavailable
- 3
Ready rate: 50%
Awaiting official assessment
Category 3 15 indicators
Resource and Energy Utilization
- Ready
- 0
- In progress
- 10
- Not started
- 0
- Unavailable
- 5
Ready rate: 0%
Awaiting official assessment
Category 4 5 indicators
Waste Management
- Ready
- 0
- In progress
- 0
- Not started
- 0
- Unavailable
- 5
Ready rate: 0%
Awaiting official assessment
Category 5 13 indicators
Environment and Safety
- Ready
- 0
- In progress
- 0
- Not started
- 0
- Unavailable
- 13
Ready rate: 0%
Awaiting official assessment
Category 6 6 indicators
Procurement and Hiring
- Ready
- 0
- In progress
- 0
- Not started
- 0
- Unavailable
- 6
Ready rate: 0%
Awaiting official assessment
Category 7 2 indicators
Green Office Operations for Continuity
- Ready
- 0
- In progress
- 0
- Not started
- 0
- Unavailable
- 2
Ready rate: 0%
Awaiting official assessment
Story: Performance → Indicators → Evidence → Action Plan
Evidence readiness is separate from progress and resource performance — not an assessment score.
Selected Activities
Campaigns and training linked to Green Office criteria

Campaign 2569
กิจกรรมการทำปุ๋ยหมักฯ จากเศษวัสดุอินทรีย์

Campaign 2569
กิจกรรมวันสิ่งแวดล้อมโลก "GREEN SYNERGY ปรับวิถีออฟฟิศ เพื่อโลกที่ยั่งยืน"

Preparedness 2569
กิจกรรมการเตรียมความพร้อมกรณีฉุกเฉิน เพลิงไหม้ และการปฐมพยาบาลเบื้องต้น
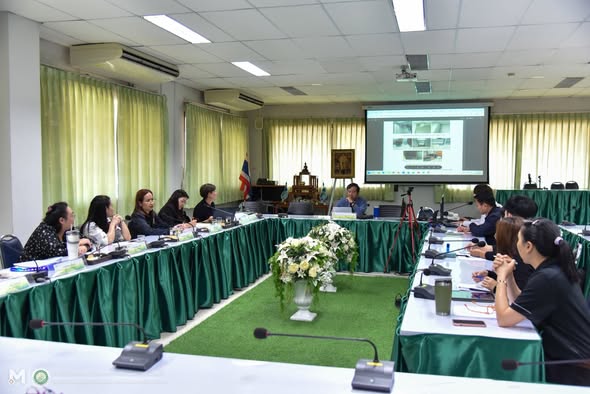
Assessment 2569
ตรวจประเมินสำนักงานสีเขียวภายในสำนักงาน (Green Office) ประจำปี 2569

Campaign 2569
กิจกรรม Big Cleaning Day ครั้งที่ 1 ประจำปี 2569

Meeting 2569
ประชุมคณะกรรมการดำเนินงานสำนักงานสีเขียว (Green Office) ครั้งที่ 1/2569

Green Office 2026
Show · Measure · Prove · Improve
Not an official assessment score — FY2569 data entry is in progress.